Decentralized sharing of validator health metrics
Authors
Henri Pihkala
Matthew Fontana
Matthew Rossi
Abstract
This document proposes a decentralized, open, and secure data pipeline for sharing a broad set of Polygon validator metrics. It enables an ecosystem of early-warning and node monitoring tools to be built by anyone, thereby improving network health, transparency, and decentralization. The data sharing is based on a peer-to-peer data transport protocol.
Motivation
This document proposes a system for extracting health metrics from validator nodes and making them available for tool builders, all in a decentralized way. The proposal seeks to address the following problems:
- Currently validators mostly discover issues after they occur, i.e. they start missing checkpoints and risk getting slashed.
- Few validators have the ability to set up elaborate monitoring and early warning systems for themselves.
- Even those that do set up such systems are reinventing the wheel every time.
- Some issues are not observable just by looking at your own nodes, for example: “Is my node up to the latest block, or is it lagging behind others?”
- Delegators have no way of evaluating validator health in depth and in advance of problems appearing
Building upon those problems, the goals of this proposal are as follows:
- Decentralized, open, and secure sharing of Polygon validator health metrics
- Data should be available to anyone => Anyone can build alerting and monitoring tools
- Such tools immediately benefit all validators at once
- Improve network health, transparency and decentralization
- Non-invasive: zero changes needed to Bor and Heimdall
- Open data is fertile ground for innovation in hackathons and grant programs
There is currently a proposal by Michael Leidson attempting to solve some of the same problem space. It suggests a centralized client-server architecture for monitoring of latest block, while this proposal suggests a decentralized architecture for sharing a broad set of of health metrics.
A decentralized system has several advantages over a centralized approach, including:
- No single point of failure
- Inherent scalability
- No trust required
- No central party from legal perspective
Currently, there exist some validator health dashboards such as this one, which shows limited information about Bor nodes. The system proposed here improves on the status quo by enabling very detailed dashboards and alerting systems to be constructed by anyone for both Bor and Heimdall nodes, as well as both validator and sentry nodes, all based on a decentralized stream of detailed metrics shared voluntarily and securely by the validators themselves.
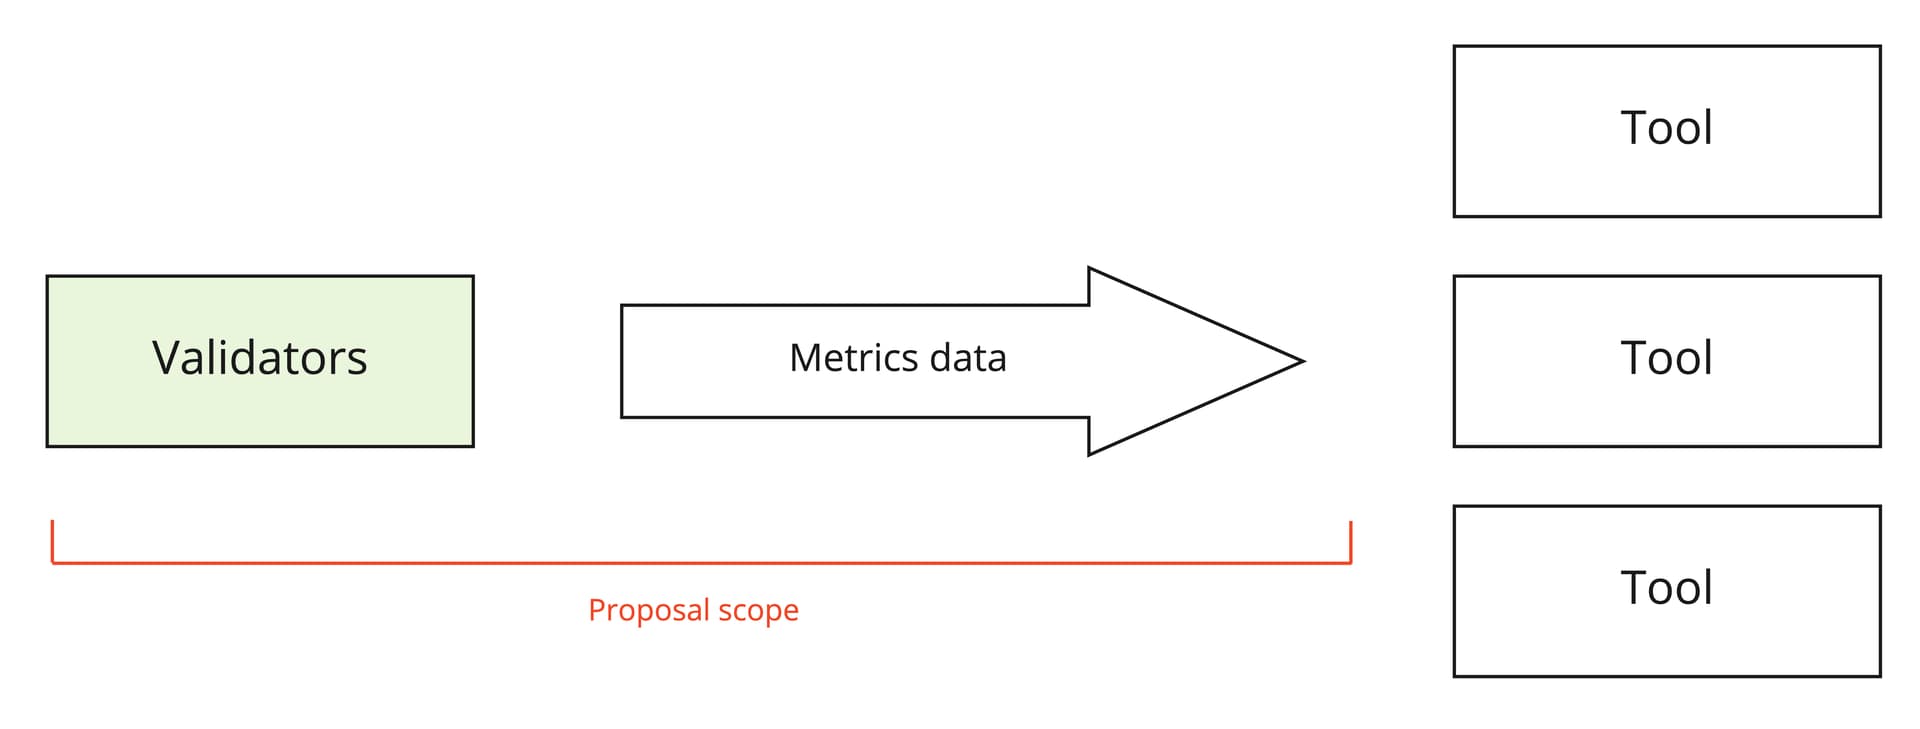
This proposal maintains a non-invasive approach that requires no changes to the Heimdall and Bor software, and uses a separately running Metrics node to extract, prepare, and share the data at regular intervals.
Instead of just the most recently seen block information proposed by Leidson, this proposal suggests sharing a broader set of metrics available from the Prometheus-compatible metrics API on both Bor and Heimdall nodes (as leveraged by the Prometheus exporters for Polygon nodes available in the Ansible playbooks for Polygon).
Benefits
The proposed approach enables and powers an ecosystem of early-warning systems, helps troubleshoot problems with validator performance, and gives the community access to validator health data, boosting innovation and confidence in the Polygon ecosystem.
The technical architecture presented here is scalable and robust, contains no single point of failure, allows anyone to access the data, and is extensible to include any details available from the nodes in the future.
In/out of scope
This proposal does not specify what kind of end-user tools should be built on top of the data. It simply describes a pipeline and protocol for collecting and distributing data to such future tooling.
In scope:
- What data is shared
- How the data is obtained from Bor and Heimdall nodes
- How the data is formatted
- How the data is made available and distributed
- Implementation + Docker image
- Recommendations for the practical setup
Out of scope:
- What exact monitoring systems and tools should be built on top of the raw data
Specification
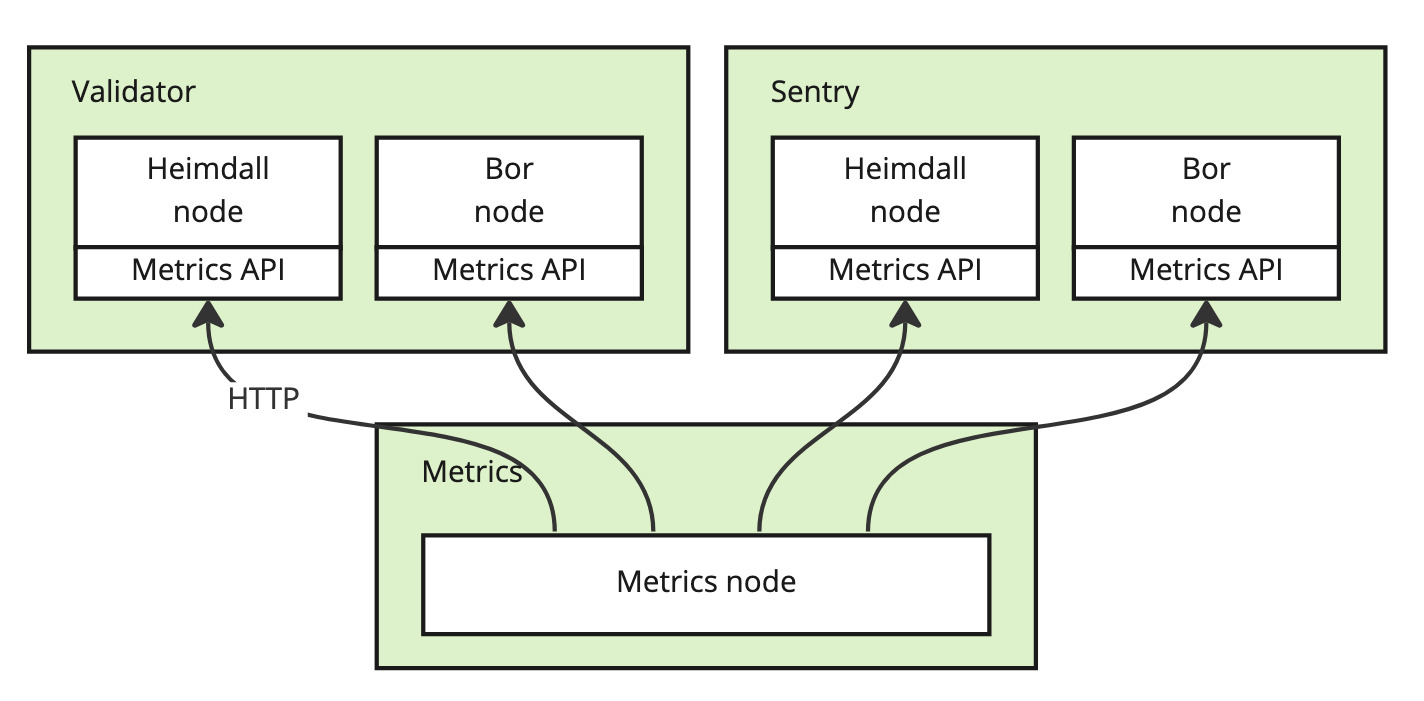
The solution introduces a new component into a validator’s setup: a Metrics node. The Metrics node has low resource requirements and can run on a separate VM. The Metrics node collects the metrics by periodically querying the Prometheus metrics API present on both Heimdall and Bor nodes.
The Metrics node publishes the metrics data over a decentralized peer-to-peer network that implements the publish/subscribe (a.k.a. pubsub) messaging pattern. In pubsub, data is published to a named ‘topic’, and anyone can join the topic as a subscriber to receive the stream of data. The peers, consisting of Metrics nodes and subscribers, form a mesh of connections with other peers. Each peer forwards the data to a number of other peers in the network, thereby eventually reaching all peers in the network. Since each node is connected to a limited number of peers, and the data travels through multiple redundant connections, such networks scale very well, are fault tolerant, and most importantly, don’t depend on any centralized server.
Each data point is cryptographically signed, ensuring that data can not be tampered with or spoofed, and it can always be traced back to the source node. Subscribers validate the signatures to ensure that the data was indeed produced by one of the validators in the Polygon network.
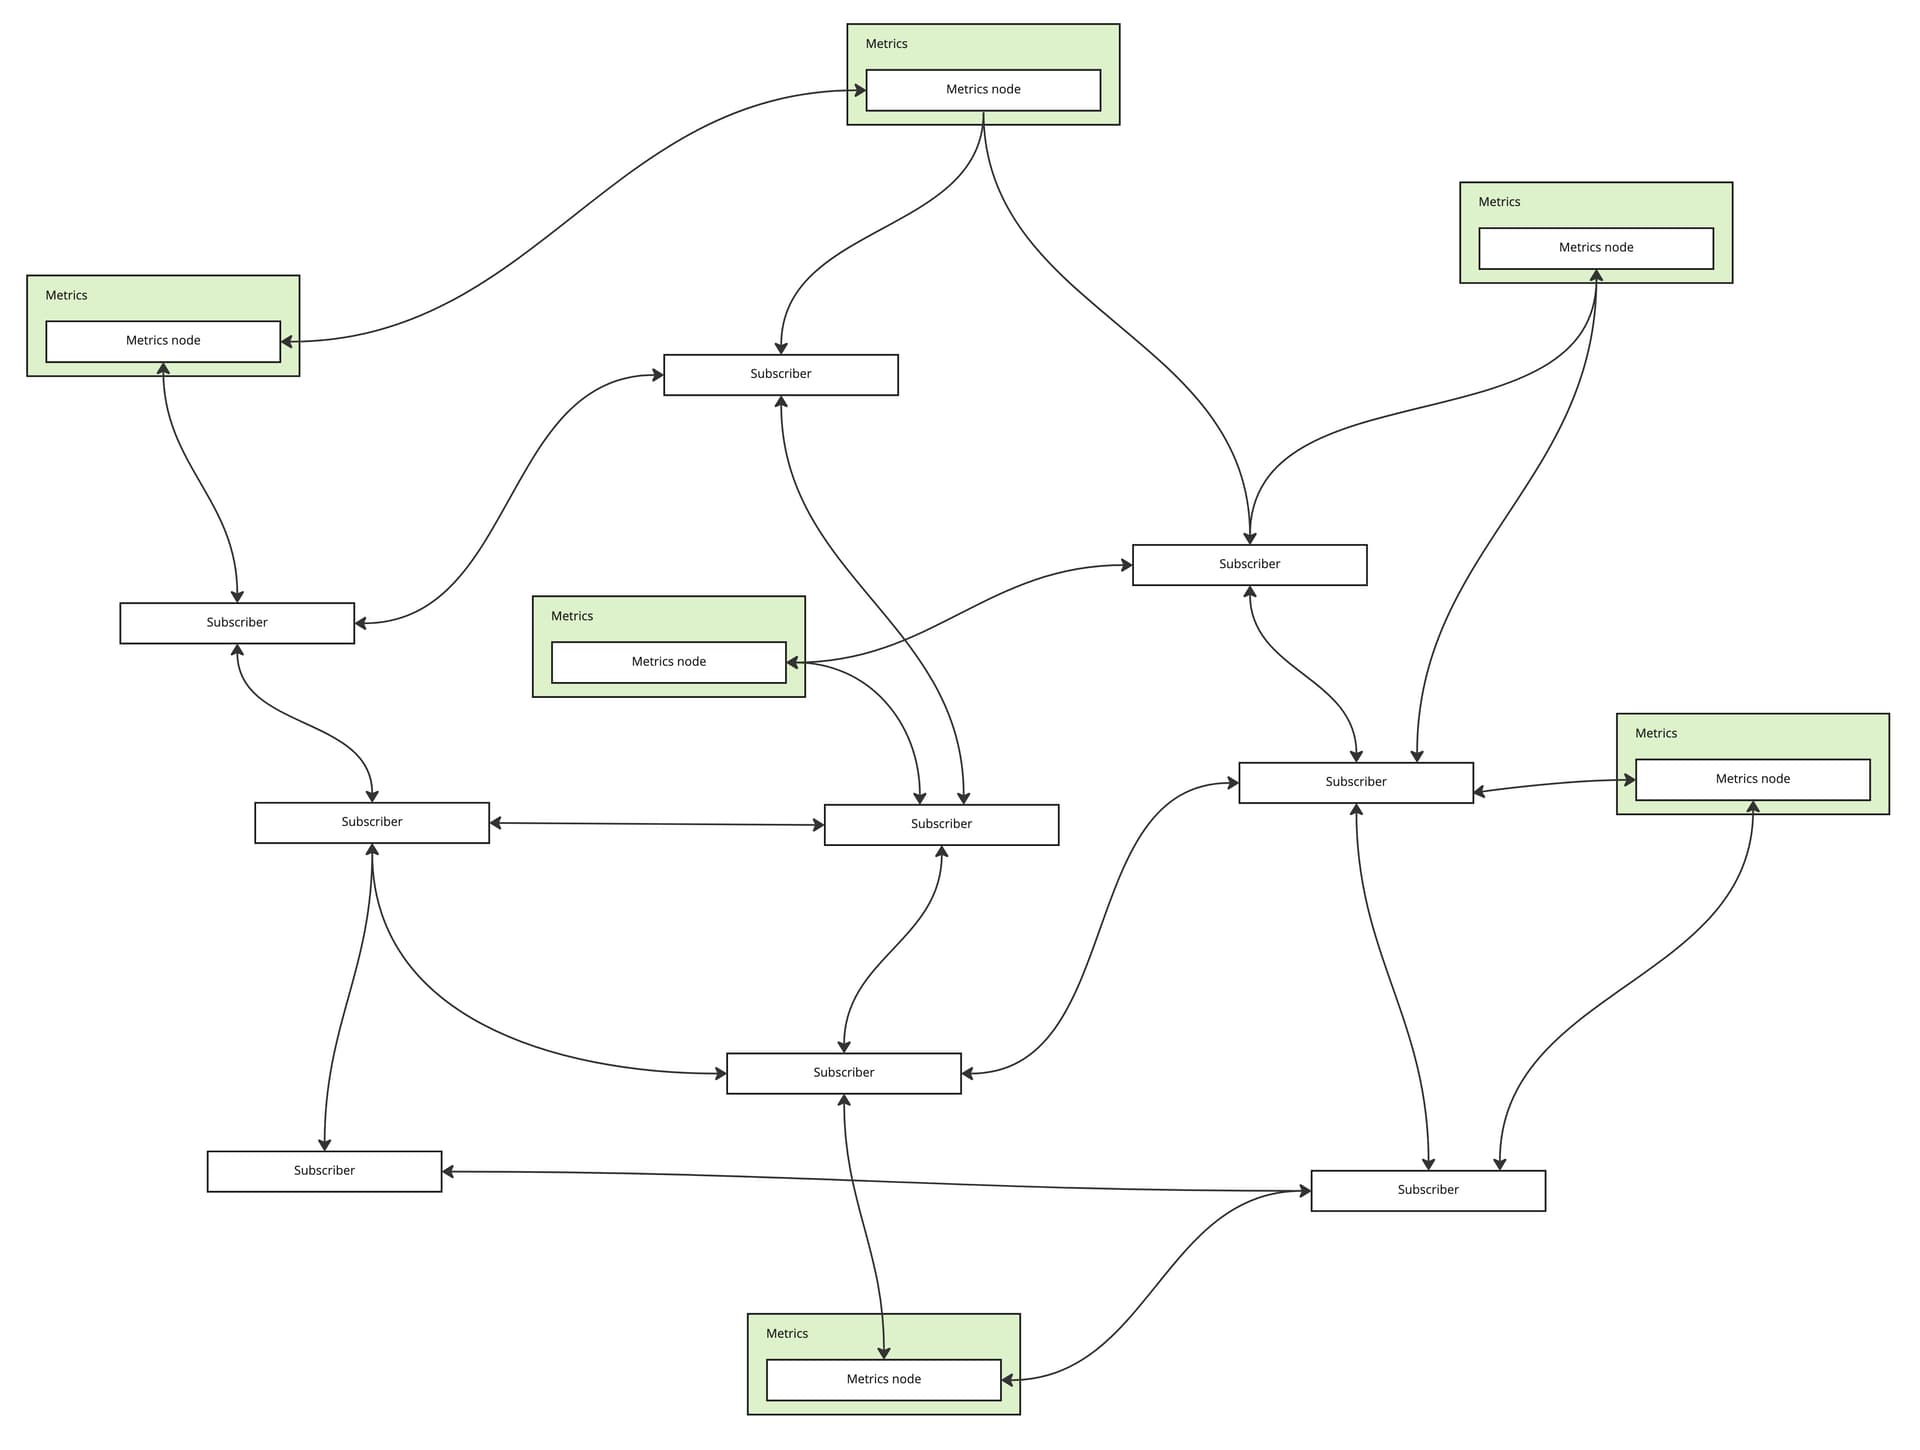
The subscribers can be any kind of applications: dashboards, analytics backends, alerting and monitoring systems, and so forth. The data is public and can be subscribed to by anyone, at massive scale. Applications built on top of the raw data can do whatever they wish with it, for example aggregate data, store a history of data, or even publish the aggregated data in realtime to another topic on the same data network. The network itself can also store the raw data points published by validator nodes for later retrieval and batch processing by applications.
The Metrics node can be distributed as a Docker image, making deployment and installation easy regardless of platform. The Metrics node has minimal CPU and memory requirements and does not consume disk space over time. While the Bor and Heimdall nodes need to be run on heavy-weight machines, a humble VM is enough to host the Metrics node, making it inexpensive for validators to run.
Rationale / Technology choices
The main technology choice here is the decentralized pub/sub messaging protocol to be used. The main alternatives in the space are:
- LibP2P pubsub (or derivatives thereof, such as Waku v2)
- Streamr
For the P2P data distribution in the Polygon Metrics network, the Streamr protocol is proposed for the following reasons:
- It is scalable, fast, and robust,
- It is already being used for decentralized metrics collection,
- The Streamr protocol is native to the Polygon ecosystem: the involved smart contracts (for access control etc.) are on Polygon,
- The core Streamr team runs a Polygon validator node,
- No new tokens are introduced - the Streamr Network works on shared reciprocity.
Additionally, the choice has the following advantages against libp2p for this particular use case:
- It has access control features backed by on-chain permission registries
- It has QoS features like message order guarantees and detecting missed messages
- It supports storage and playback of historical data
- It uses the same cryptographic primitives as Polygon and Ethereum, meaning identity equivalence (all Polygon/Ethereum private keys/addresses are also Streamr private keys/ids)
- It supports adding incentives to data sharing, which can be useful in case validators don’t otherwise opt-in to metrics sharing
(Full disclaimer: the authors of this proposal are Streamr contributors, which obviously introduces bias to the technology recommendation, but on the other hand it’s probably fair to say that the authors are experts on the subject matter as well as Polygon advocates.)
For further reading, here’s a thought piece about collecting metrics data from decentralized systems.
Proposed work phases
We propose to divide the work into the following phases:
- [COMPLETED] Proof-of-concept: A Metrics node implementation is demonstrated to pull data from a Bor and Heimdall node and make it available over the peer-to-peer network to any number of subscribers
- Pilot rollout: Metrics nodes are rolled out to a limited number of Polygon validators
- Full rollout: Metrics nodes are rolled out to all Polygon validators
Proof-of-concept
There’s an initial implementation of the Metrics node in this Github repository. As a proof-of-concept, one Metrics node has been deployed and connected to the Polygon validator nodes run by a few validators. The below links display the raw metrics data published in realtime to the following streams, one per each node type:
- polygon-validators.eth/validator/bor
- polygon-validators.eth/validator/heimdall
- polygon-validators.eth/sentry/bor
- polygon-validators.eth/sentry/heimdall
Here are snapshot examples of what the data looks like: Bor , Heimdall . As you can see, the data contains a wealth of metrics. Important point: whatever metrics are added to the Bor/Heimdall nodes in the future automatically appear in the shared data. This makes the solution very future-proof and enables the Bor and Heimdall dev teams to extend the system with new variables as they please.
Builders seeking to use the data can easily subscribe to the above streams using one of the following Streamr protocol resources:
As a bonus, to also show something simple built on top of the data, here’s a quick 5-minute demo dashboard on JSbin that shows a few selected metrics, including current block, peer count, and some cpu and memory -related variables. Of course, it currently shows data for only a few validators, because others have not onboarded yet. With complete data, it would be easy to see for example whether some nodes are lagging behind just by looking at the latest block number of each validator - something which is hard to determine just by looking at your own node.
Cost of operation
The cost depends on the cloud/data center solution used by each validator. A virtual machine with, say, 4 GB RAM and 2 vCPUs should be fine for this, although this needs to be verified in the PoC phase. The cost of running such a node ranges from around $5-8/month on cheap providers like Hetzner or Contabo to maybe $20-30/month on more expensive providers like AWS or Azure.
In any case, the costs of running the Metrics node are negligible compared to the heavyweight machines with large, fast disks required to run Bor. The total increase in validator operating expenses will likely be less than 1%.
Limitations to the applicability of the data
The validator nodes self-report the data, meaning that they could simply lie. The attached cryptographic signatures prove that the data originates from a certain Metrics node, but not that the values shared correctly represent the actual state of their Bor and Heimdall nodes. This is a fundamental limitation and not a technical shortcoming of the system.
We propose that slashing and other ‘hard’ measures continue to be strictly based on the validators’ adherence to the Bor and Heimdall protocols, such as signing checkpoints and so forth, like they are now. The metrics data complements this by helping reach ‘softer’ goals, such as helping the validators themselves (“Are my nodes healthy?”), other validators (“Are my nodes performing as well as other validators?”), and the Polygon community (“Are Polygon validators healthy and reliable?”).
Security considerations
It’s recommended as a security best practice to run the Metrics node on a separate VM to isolate it from the Bor and Heimdall nodes and networks. This way, the Metrics system can not disrupt or influence their operation in any way. The Metrics node only needs access to the Prometheus metrics port on Bor and Heimdall nodes in order to query metrics, which is easy to accomplish via firewall rules that allow those ports to be accessed from the Metrics machine.
Similarly to Bor and Heimdall, the Metrics node uses a private key which is stored on disk. The Metrics key can be a different key than the Signer key used with Heimdall/Bor. If a Metrics private key gets compromised, the key is easy to revoke from the metrics streams’ access control lists and replace with a new one. While care should definitely be taken to safeguard the key, the damage from a compromised Metrics key is much less compared to an Owner or Signer key of the actual validator nodes getting compromised, as those can lead to theft of stake or heavy slashing.
The Metrics node does not need to open any ports, which helps secure it against DoS attacks - although it does need to allow traffic in a range of UDP ports.
With proper isolation from the Bor and Heimdall nodes as described above, possible attacks can only disrupt the metrics system: either individual Metrics nodes or the whole Metrics network itself. Disrupting individual nodes does not compromise the data flow in the network as a whole, as data always travels through many redundant paths through the network.
On the network level, all P2P networks are by their nature vulnerable to certain types of attacks, in particular eclipse attacks. This applies to for example Bitcoin, Ethereum, Polygon Bor, Polygon Heimdall, and the proposed Metrics network. The chosen network parameters play a large role in how robust the network is against attacks. For example, blockchain networks typically defend against eclipse attacks by having a high number of connections to other peers (up to hundreds), which is a performance vs. security tradeoff.
Unlike blockchains, the Metrics network is ‘only’ a data distribution network and does not secure digital assets nor maintain consensus. It is therefore a lower-value target and lower-risk overall: a nice-to-have, but not connected to the operation of the Bor or Heimdall networks in any way. This also allows the Metrics network to choose a slightly less defensive P2P parameterization to fit the use case better, improve efficiency, and reduce bandwidth consumption.