Hey all! I’m a member of Pyor.xyz
We’re a blockchain analytics firm and we work with protocols by giving high-fidelity insights. We have our own data product which we use to perform analysis and deliver insights to institutions like Ribbit Capital, CitiBank, and Goldman Sachs.
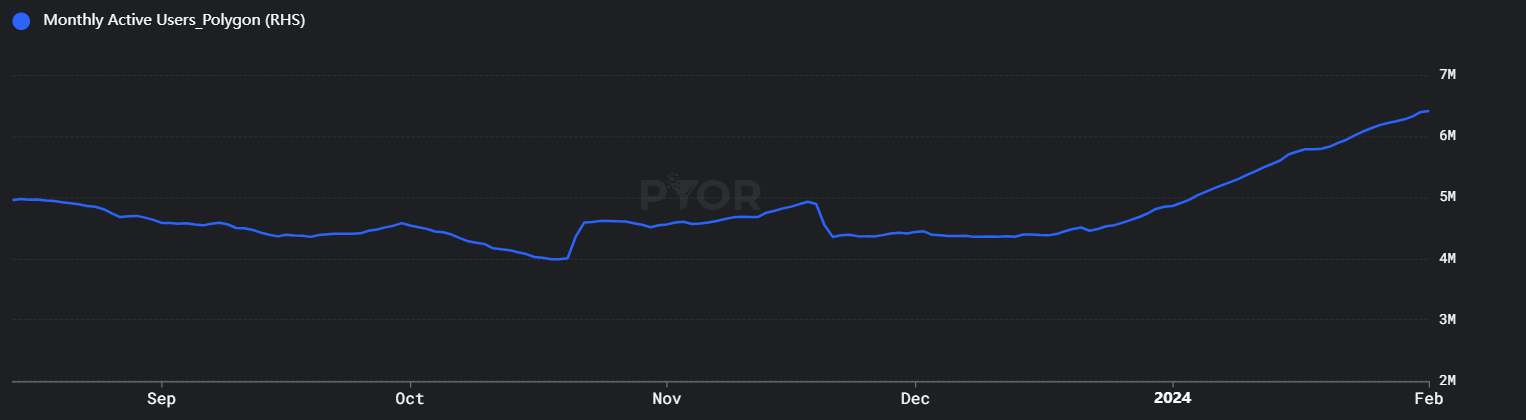
While analyzing Polygon, we noticed a steady increase in the MAUs from the month of December, which can be attributed to lower transaction fees and possibly the surge of P2E activities. This ensures the integrity and security of the protocol.
I believe our services at PYOR can facilitate the protocol’s journey to achieving expansion by developing active users analytics and performance dashboards. Moreover, we have similar in-depth data of all top L1s/L2s which will help in monitoring past performances of other protocols after restructuring network fees.
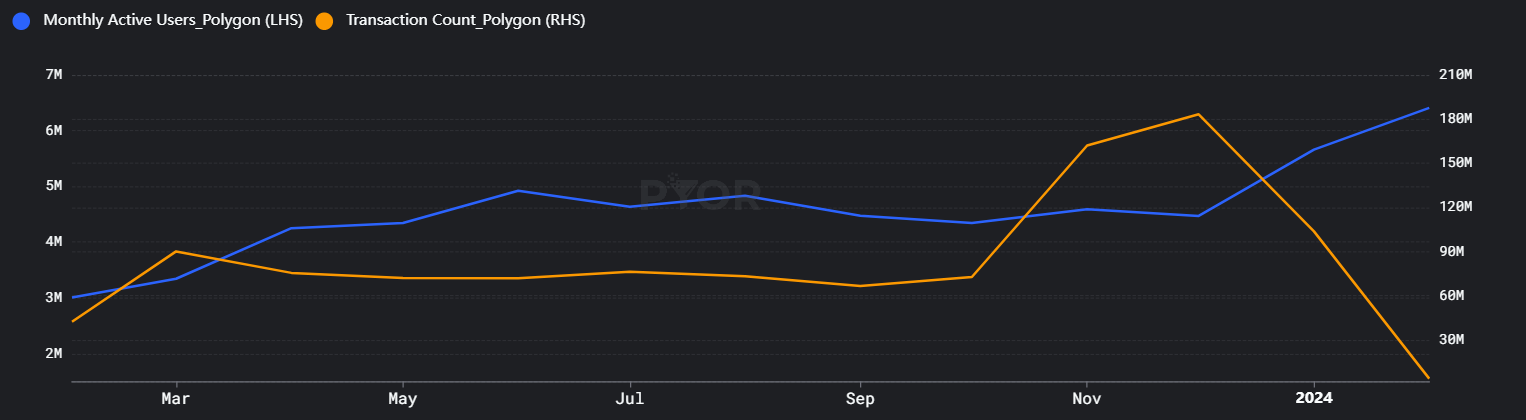
We are also proposing a detailed ecosystem report for Polygon for the year 2023. The objective of this report is to give investors and the ecosystem a comprehensive understanding of the protocol. Example - Between December to February, Polygon’s monthly active users increased by 42%. But on further analysis, the monthly transaction count per user decreased significantly by 98%, a data point that no one else offers.
The data shows the total value of the users of that specified month and usually the activity metrics are compiled at month ends but as only 2 weeks have elapsed in February the estimates are roughly predicted and approximated.
Our report will be exhaustive to cover all aspects of User Engagement (Retention, Volume, Concentration, On-chain activity, etc.), Operating Metrics (Revenue, Fees, Working Capital, etc.), Competitor Analysis, and Financial Metrics. We encourage the community to incorporate other data points that the foundation would like to have.
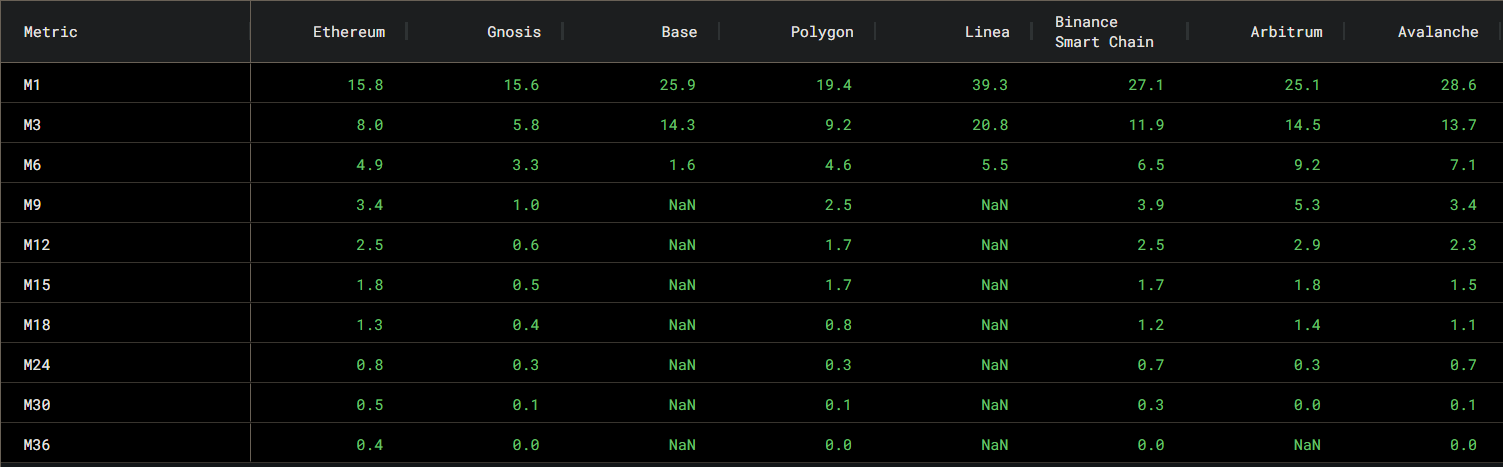
Curating such a report will also give the foundation insights to effectively set goals for 2024, propelling the development of the protocol. Example - Our analysis shows the retention of new Polygon users is only 19% after the first month, ranking 10th out of the top 17 chains. This insight will allow the foundation to structure initiatives to retain more users in the long term.
Here are dashboards we’ve built in the past:
Compound - Compound Dashboards
QuickSwap - QuickSwap Dashboards
Here are similar reports that we have done in the past:
Tezos - Tezos Ecosystem Report 2022
We at PYOR are not currently pursuing any affiliation or endorsement and are happy to serve the community with the products we offer. In short, I believe PYOR has a lot of the vital data of all the L1/L2 which is not put forward anywhere else.
Curious to hear your thoughts on this and suggestions are always appreciated. ![]()